 Menu
Menu
Menu
Menu
Linnard Financial Management & Planning, Inc.
Fee-Only Financial Planning and Investment Advisor
April 1, 2024
Mark Twain is said to have written, "History never repeats itself, but it does often rhyme". Winston Churchill remarked, “Those that fail to learn from history are doomed to repeat it.” Warren Buffet observed, “What we learn from history is that people don't learn from history.” This issue of Outlook & Trends will attempt to put the current markets in a historical context, so that we can be prepared to learn from history and not repeat it. How closely will it rhyme this time?
The economy has been humming as the Inflation Reduction, Infrastructure, and Chips acts pumped money from deficit spending into the economy, although the 3.4% GDP annualized growth rate in the fourth quarter of 2023 was lower than the 4.9% growth recorded in the third quarter. The estimated first quarter 2024 rate is a still lower 2%. The Federal Reserve reported a “slight” increase in economic activity during February, paralleling the ISM Purchasing Manager’s Index that suggested that the services sector expanded while manufacturing continued to contract. Unemployment has increased slightly to 3.9%, but the count of job openings has been stable. The Index of Leading Economic Indicators, turned positive after 22 straight monthly declines. One factor contributing to the uptick was strength in the stock market.
Inflation is beginning to stabilize at 3.2% after the post-COVID run-up and equally fast decline last year. It is still some distance from the Federal Reserve’s target of 2%, but is no longer increasing at an economically disruptive rate. Although the growth rate has normalized, prices remain considerably higher than just a few years ago. The National Association of Realtors reports that the average price of a single family home is up 5.6% nationally over a year ago, while northeastern homes are 12.3% higher. Not surprisingly, their measure of affordability deteriorated over the period despite an increase in family income.
Stocks continued to ride the speculative wave fueled by the recent explosion of interest in artificial intelligence and government deficit spending. The S&P 500 index established a strong uptrend by breaking above the prior high that was set in January 2022. Large capitalization stocks continued to outperform the average stock during the quarter. While the trend and momentum are currently strong, the valuation risk has also continued to grow commensurately.
Longer-term bonds have not shared in the stock investment recovery. Fixed income investments were flat to down during the last quarter. The total return of an exchange traded fund based on the 10-year Treasury bond has been negative over the past year. A similar ETF based upon corporate bonds is slightly positive. The performance of the iconic 60% stock / 40% bond balanced investment portfolio has been retarded by the bond component for the last four years.
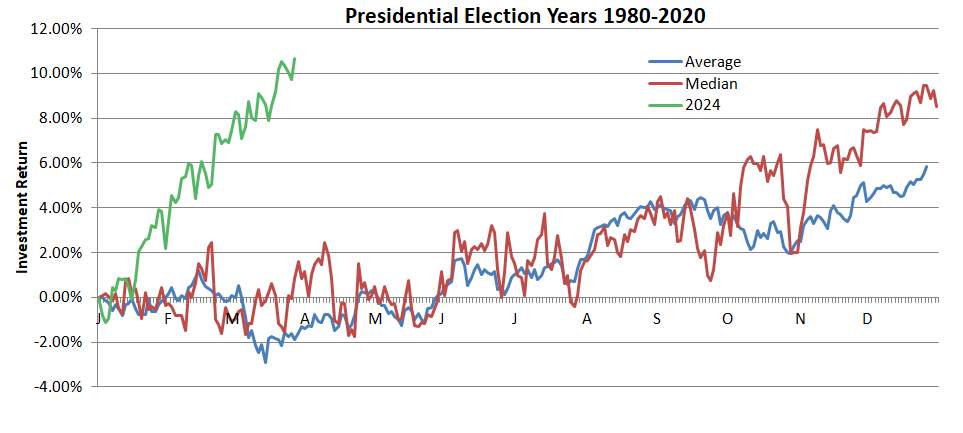
This is a presidential election year. A review of history suggests that equity markets are up on average during presidential election years. The chart below shows the average and median return for all the presidential election years going back to 1980. You can see the trend is generally up. Usually the period from mid-March to mid-April has been strong as well as June, August, and the post-election period. This is because presidents, and often the Federal Reserve, adopt spending policies early in their terms that blossom later as deficit spending adds money and jobs to the economy near the election. Historically speaking, this year has been unusual, propelling the markets up to an average full year return in just the first quarter as the Magnificent 7 and artificial intelligence re-ignited a speculative fervor. The exceptions to the usual upward trend occurred in 2000 and 2008. These years spawned major bear markets, which is why the average and the median separate toward the end of the year. What was different in these years? Markets began from higher valuation levels that were preceded by Federal Reserve monetary tightening programs.
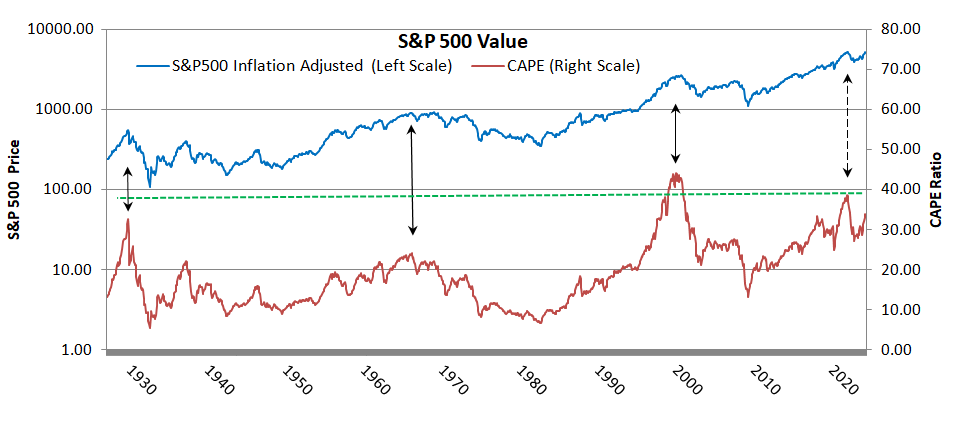
The following chart shows how markets react over the long term in response to valuation levels. The valuation metric shown is Robert Shiller's Cyclically Adjusted Price Earnings Ratio, but there are a number of other long-term valuation methods that tell the same story. The depiction of the S&P 500 is inflation-adjusted and presented on a logarithmic scale. The green dashed line is today’s valuation. While history teaches that the stock market always has risen over the long-term, examination shows that there are decades and longer when markets have essentially no gain and do not keep up with inflation. When do those periods begin? When valuation levels are high. It can be seen that market prices can continue to rise while valuations are high, but that means that they continue to become ever more expensive, and the end result will be more severe. You can see that valuations were very high in the 2000 election year, moderately high in the 2008 year, and very high before the 2020 election and the bear market that was triggered by the COVID pandemic. Values are high again today, surpassing 2008, rivaling 1929 and approaching 2000. History suggests that while markets could continue to climb, especially if the government continues to pump up the economy, we should not bet the farm if a nearby retirement is at stake.
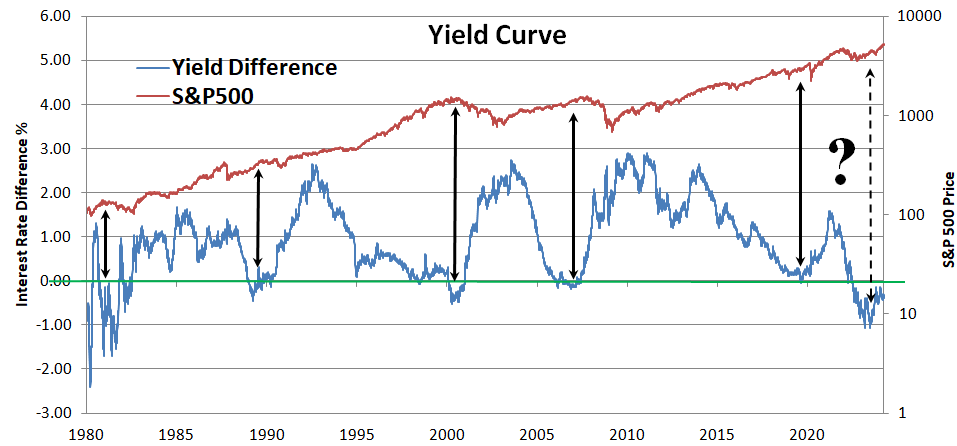
Federal Reserve policies have an effect on the economy and investment markets. When the Fed makes loans more expensive or harder to come by, typically economic growth slows down, since it is harder to earn a return on initiatives that use more expensive borrowed money. The Fed directly controls short-term interest rates, but has less control over long-term rates, so the relationship between short and long term interest rates is indicative of how stringent Fed policy is. When the two-year Treasury note short term rate rises above the ten-year long-term rate, this is called an inverted yield curve. These times are shown in the graph below when the blue line falls below the green line. Historically these times have always resulted in a recession. There is frequently a delay, however, since it takes time for the policy to bite. Recessions typically result in a muted stock market performance or worse. The chart compares how markets performed after an inverted curve. Sometimes losses were significant, other times not so much. What was the difference? Compare the valuations at the time of the inverted curves. The big bad markets started from high valuations and were triggered by Fed policy that inverted the yield curve.
It is possible that the current condition is different from the past. It certainly has been different so far this year. As Mark Twain suggested, “History does not repeat, but it often rhymes”. Given the history, it is up to each of us to assess the probabilities vs. our financial plans and requirements.

David C. Linnard, MBA, CFP®
President
LINNARD FINANCIAL MANAGEMENT & PLANNING, INC.
46 CHESTER ROAD
BOXBOROUGH, MA 01719

Barbara V. Linnard
Vice President
LFMP@LINNARDFINANCIAL.COM
WWW. LINNARDFINANCIAL.COM
978-266-2958
 |
 |
 |
A Registered Investment Advisor and NAPFA-Registered Financial Advisor


The contents of Outlook & Trends reflects the general opinions of LFM&P, which may change at any time, and is not intended to provide investment or planning advice. Such advice is only provided by means of individual agreement with LFM&P.